• Efficiency: iPhone 17 Pro Max vs. Galaxy S26 Ultra (using EU 2023/1670 Standards)

    From Maria Sophia@mariasophia@comprehension.com to comp.mobile.android on Sat Apr 18 21:18:24 2026
    From Newsgroup: comp.mobile.android

    Efficiency:
    iPhone 17 Pro Max vs. Galaxy S26 Ultra (using EU 2023/1670 Standards)

    Marketing departments can no longer hide behind amorphous (yet brilliant) efficiency claims because the EU requires standardized reproducible data.

    a. Longevity (The "Kill Time"): With Samsung's battery rated for 1,200
    cycles vs. Apple's 1,000, Samsung wins the long game on durability.

    Even with similar power draw, the more resilient chemistry wins
    the "years of use" metric over the crappy Apple battery components.

    b. Efficiency can be considered to be work done per unit of energy.
    i. iPhone 17 Pro Max: 53 hours / 4.8 Ah = 11.04 hrs/Ah
    ii. Galaxy S26 Ultra: 55 hours / 4.855 Ah = 11.33 hrs/Ah

    The margin is razor-thin (~2.6%) in favor of the Samsung device.
    Despite Apple's (admittedly brilliant) claims, it's not more efficient.

    Even Apple's historic crappy capacity isn't what hurts the iPhone here.
    a. Capacity: Samsung 4,855 mAh / Apple 4,800 mAh (slight Samsung win)
    b. Endurance: Samsung 55 Hours / Apple 53 Hours (slight Samsung win)
    c. Cycle Life: Samsung 1,200 Cycles / Apple 1,000 Cycles (Samsung win)
    d. Kill Time: Samsung ~7.53 Years / Apple ~6.05 Years (big Samsung win)

    Even though the iPhone "efficiency" claims are shown to be nothing more
    than (admittedly brilliant) marketing propaganda, to be fair to Apple,
    for all we know the iPhone may have a higher "Idle Efficiency" (perhaps due
    to presumed aggressive background management for all that we know).

    However... Apple doesn't get to claim an efficiency based on placing a
    phone in a drawer with nothing running and then claims it lasts longer.

    The EU standardized test simulates active use-scrolling, calling and video where raw hardware efficiency matters most.

    Like almost all my posts, I provide information that is found only in the
    most accurate specifications on the net, where I ask others to check my
    numbers because even I was surprised the iPhone lost on all counts.

    a. On Efficiency:
    It is a statistical tie or slight Samsung win.
    The "Apple is twice as efficient" trope is officially dead.

    b. On Longevity:
    Samsung wins decisively due to better battery resilience.

    This information exposes another component of the astoundingly huge hidden
    cost of ownership of Apple products, where, if both phones cost the same,
    the Samsung offers a significantly lower "Cost Per Year" by lasting nearly
    18 months longer (in addition to far longer security promises & drastically lower repair costs).
    --
    I shill for no OEM. I treat every OEM with the science of engineering.
    --- Synchronet 3.21f-Linux NewsLink 1.2
  • From Maria Sophia@mariasophia@comprehension.com to comp.mobile.android on Tue Apr 21 14:46:07 2026
    From Newsgroup: comp.mobile.android

    Update:

    The Samsung lasts 1-1/2 years *longer* than the "efficient" iPhone
    (proving, yet again, that this bogus "efficiency" proffers no value).

    The discussion regarding the EU Ecodesign Regulation (EU 2023/1670)
    provides the first standardized 'Kill Time' metric we have ever had.

    Note: Kill-time is a term chosen to make the point, much like an LD50
    is for drug companies, that it's a calculated value to a detrimental state.

    I'll ignore the insults and focus on the facts because it's important
    to parse the (admittedly brilliant) marketing propaganda surrounding this bogus amorphous "efficiency" that has never once resulted in actual value.

    To that end of forcing the OEM's hand at actually defining that
    (admittedly brilliant but bogus) "efficiency" claim, we have to all
    thank God for the UK & for the EU forcing OEMs to common benchmarks!

    Even I'm learning more about it every day, where I belatedly realized I
    had misquoted the numbers from the EPREL/EU certified test profile, which
    is a rigid, simulated "day" that every phone must run to get its label.

    It turns out that it's much worse than I had previously calculated in
    that the Galaxy S26 Ultra delivers ~24.5% more total standardized battery
    life to 80% capacity than the iPhone 17 Pro Max.

    That's roughly 542 extra days, or about 1.5 years of calculated use.
    So much for that bogus amorphous (yet admittedly brilliant) "efficiency". .

    Among other things, under these UK/EU European rules, manufacturers must declare the cycles a battery withstands before dropping to 80% health.

    They could have picked any percentage.
    They picked 80%.
    So that's what we will use.

    1. The specifications (EU certified)
    A. Apple iPhone 17 Pro Max
    a. Capacity: 4800 mAh
    b. EU Endurance (Single Charge): 53 hours
    c. EU Cycle Rating (to 80%): 1,000 cycles
    d. Daily Cycles (24h/53h): 0.45283 cycles/day

    B. Samsung Galaxy S26 Ultra
    a. Capacity: 4855 mAh
    b. EU Endurance (Single Charge): 55 hours
    c. EU Cycle Rating (to 80%): 1,200 cycles
    d. Daily Cycles (24h/55h): 0.43636 cycles/day

    2. 'Kill Time' = Total Life Cycles / Daily Cycles
    A. Apple iPhone 17 Pro Max:
    1,000 / ~0.453 = 2,208.33 days (approx 6.05 years)
    B. Samsung Galaxy S26 Ultra:
    1,200 / ~0.436 = 2,750 days (approx 7.53 years)

    3. Analysis of the data
    A. Apple iPhone 17 Pro Max
    Total Life: 2,208 days (approx 6.05 years)
    Efficiency Calculation: 53 hours í´»í²®8 Ah = 11.04 hours per Ah
    Efficiency: 11.04 hours per Ah

    B. Samsung Galaxy S26 Ultra
    Total Life: 2,750 days (approx 7.53 years)
    Efficiency Calculation: 55 hours í´»í²®855 Ah = 11.33 hours per Ah
    Efficiency: 11.33 hours per Ah
    Margin: 542 Days (approx 1.49 years)
    Lifespan Advantage: +24.5%

    4. Summary of the facts:
    a. Efficiency:
    Samsung wins. It gets 55 hours out of 4.855Ah,
    while Apple gets 53 hours out of 4.8Ah.
    b. Capacity:
    Samsung wins, though Apple has finally started closing the
    historic battery-capacity gap (but only recently).
    c. Durability:
    Samsung wins. The 1,200 cycle rating on Samsung's 2026 chemistry
    provides the Kill-Time victory despite the claimed iPhone efficiency.

    REFERENCES:
    a. EU Regulation 2023/1670 (Ecodesign requirements)
    <https://eur-lex.europa.eu/eli/reg/2023/1670/oj>
    b. EU Regulation 2023/1669 (Energy Labeling)
    <https://eur-lex.europa.eu/eli/reg/2023/1669/oj>
    c. EPREL (European Product Registry for Energy Labeling)
    <https://eprel.ec.europa.eu/screen/product/smartphonestablets20231669>
    d. Bitkom Compliance (June 2025 Implementation Details)
    <https://bitkom-compliance-solutions.com/en/news/new-eu-requirements-ecodesign-and-energy-labelling-smartphones-and-tablets-june-2025>
    --
    One out of about ten million people know what we know about smartphones. `
    --- Synchronet 3.21f-Linux NewsLink 1.2
  • From Maria Sophia@mariasophia@comprehension.com to comp.mobile.android on Tue Apr 21 14:47:44 2026
    From Newsgroup: comp.mobile.android

    Prior I used simplified "efficiency" calculations.
    Below are more accurate corrections (results still end up similar).

    To address the "efficiency" point more rigorously using the EU data,
    we need to move beyond Amp-hours (current) to Watt-hours (energy).

    Engineering efficiency is best expressed as the "Average Power Draw"
    required to sustain the EU standardized "Day" profile.

    1. Technical Efficiency Analysis (Energy vs. Power)
    Standard Li-ion Nominal Voltage: 3.85V

    A. Apple iPhone 17 Pro Max
    a. Total Energy (Wh): 4.8 Ah * 3.85V = 18.48 Wh
    b. EU Endurance: 53 Hours
    c. Avg. Power Draw: 18.48 Wh / 53h = 348.68 mW

    B. Samsung Galaxy S26 Ultra
    a. Total Energy (Wh): 4.855 Ah * 3.85V = 18.69 Wh
    b. EU Endurance: 55 Hours
    c. Avg. Power Draw: 18.69 Wh / 55h = 339.82 mW

    2. Efficiency Conclusion:
    a. Samsung Power Draw: 339.82 mW
    b. Apple Power Draw: 348.68 mW
    c. Delta: Samsung is ~2.54% more energy efficient per hour.

    3. Summary of Engineering Facts:
    a. Work Density:
    Samsung's hardware/software stack requires less power (mW)
    to execute the exact same EU-mandated task suite.
    b. Total Energy Throughput (Lifetime):
    iPhone: 1,000 cycles * 18.48 Wh = 18,480 Wh total life energy.
    Galaxy: 1,200 cycles * 18.69 Wh = 22,428 Wh total life energy.

    The Samsung Galaxy S26 Ultra provides 3,948 Wh more total
    utility over its lifespan than the iPhone. That is roughly
    equivalent to 213 extra "full" iPhone charges.

    Efficiency isn't just a marketing buzzword; it's physics.
    The EU data shows Samsung is doing more work with less power .

    Since this information is not found anywhere on the Internet (as far as I'm aware), please check the calculations for any omissions or errors I made.

    The goal is to make our assessments based on facts, not on propaganda.
    --
    Note: There are slight differences in battery capacity depending on if it's
    the marketing spec, the phone spec, or the EU spec for a given device.
    --- Synchronet 3.21f-Linux NewsLink 1.2
  • From Maria Sophia@mariasophia@comprehension.com to comp.mobile.android on Mon Apr 27 22:16:26 2026
    From Newsgroup: comp.mobile.android

    David Woolley wrote:
    On 27/04/2026 22:49, Maria Sophia wrote:
    Mathematically, if you charge your phone once a day,

    I think that should read: if you charge your phone from the point where
    it has powered down, to avoid over discharge, until the 100% level,
    exactly once a day.

    I believe that charging from say 30% to 80% would count as half a cycle,
    and may actually be equivalent to less than that, in terms of wear on
    the battery.

    I've got a Samsung A16, which has been charged from about 55 to 60%, up
    to 80%, once a day for about a year and a half. The statistics
    (Settings | Battery | Battery Information) say the cycle count is 135,
    which is not that inconsistent, given that the above figures are approximate. It's quoting a battery health figure of 98%. I assume
    that is the same figure as the 80% figure in the standards. I don't
    know if it represents an attempt to measure the actual capacity, or is simply: 100 - (equivalent cycles / 1000) * (100 - 80).

    If a partial cycle counted as a whole cycle, I'd expect a cycle count of over 500 and a health of a little under 90%. Also remember that there
    can be short cycles whilst connected to the charger, if power used, plus losses, exceeds power input, which if counted as full cycles, would drastically affect the the total cycle count. All in all, I think you
    would need a level of use which is almost exactly that which can only
    be sustained for one day, less the time connected to the charger. I'd suggest that many people would be aiming to have a significant amount of capacity left, at the end of the day.

    Hi David,

    Thank you for your well thought out commentary as it shows you're thinking about this in exactly the right way given we're making sense of the data.

    I appreciate you thinking about this in a sound manner as you deserve a
    serious response to your apropos observations, which I agree with. I'd
    never disagree with any logically defensible position, which yours is, especially as this kind of discussion is perhaps unique on the Internet.

    The UE/UK know that battery life is likely the primary reason phones become electronic waste. Hence, keeping track of battery-health metrics is vital.

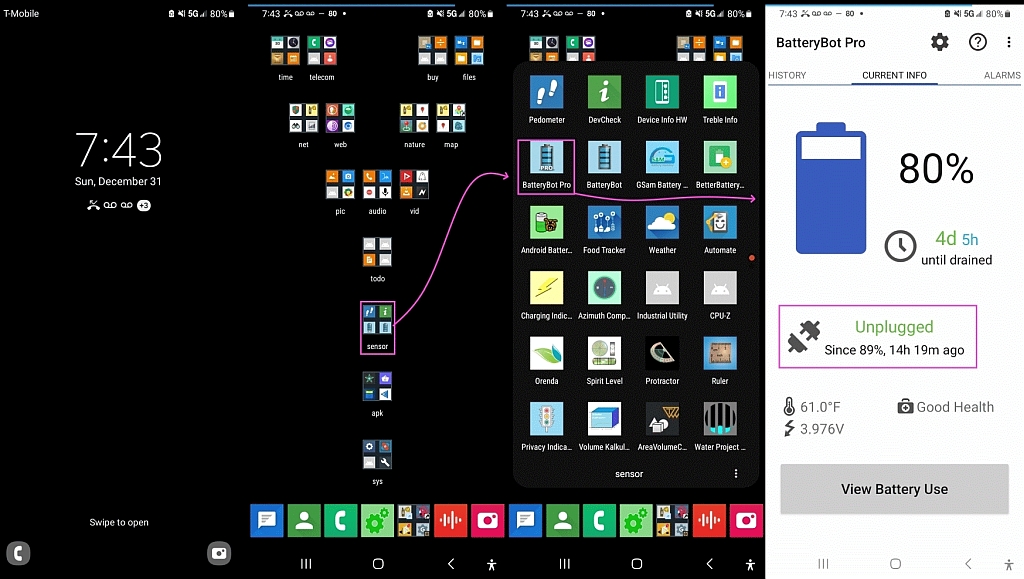
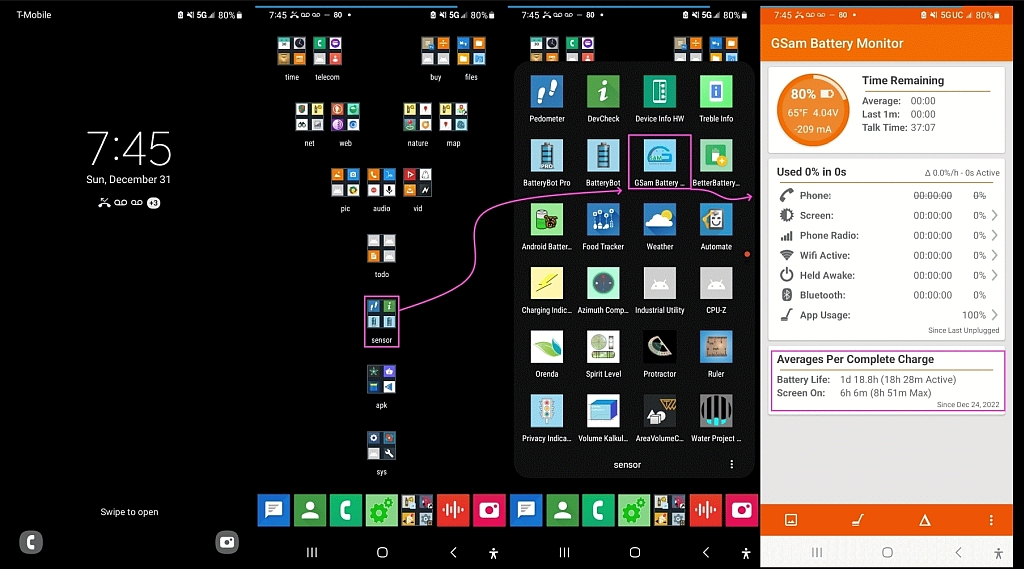
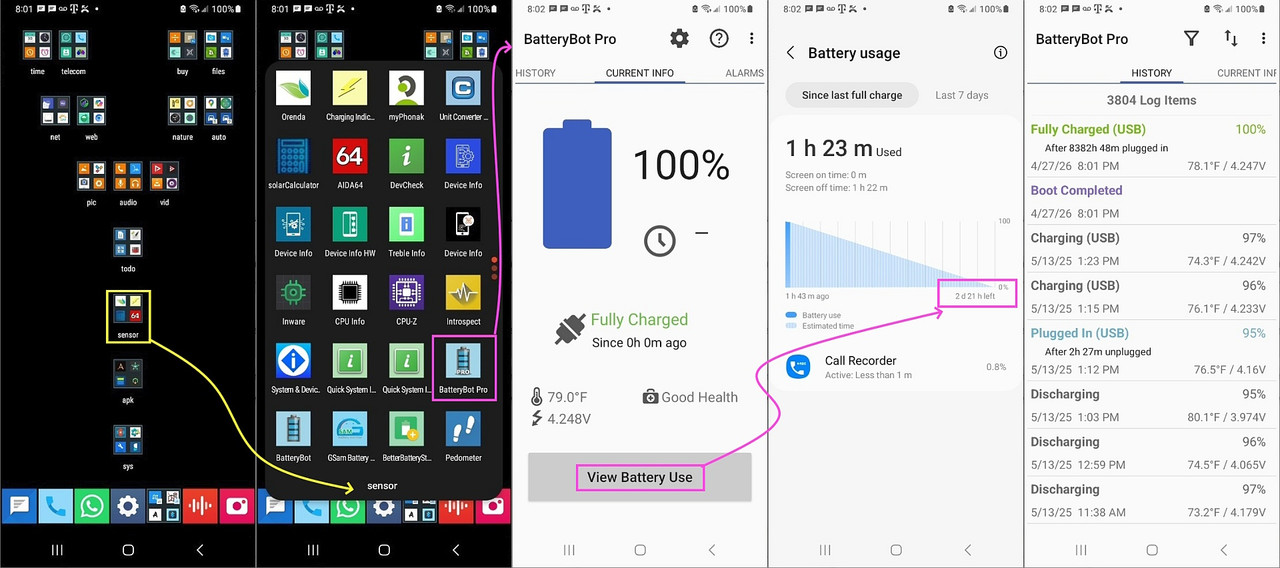
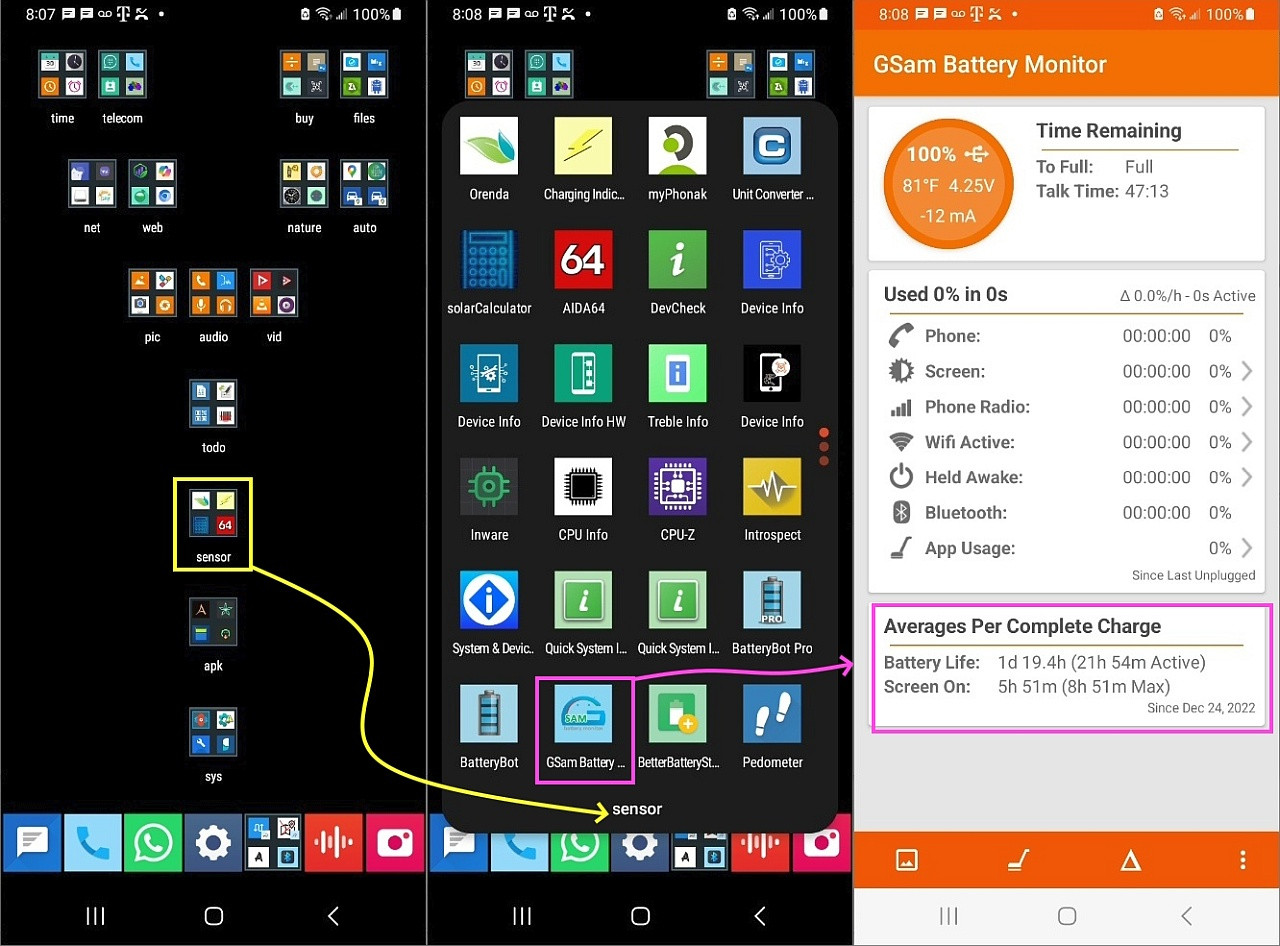
    There are plenty of utilities that help us keep track of battery
    health, where, just by way of example, here are my own screenshots: <https://i.postimg.cc/k5X8Ccpx/batterylife01.jpg> (Battery Bot 2023) <https://i.postimg.cc/sxRgjfgt/batterylife02.jpg> (GSam 2023) <https://i.postimg.cc/NfzbxFrq/batterylife03.jpg> (Battery Bot 2026) <https://i.postimg.cc/nrd2gcRH/batterylife04.jpg> (GSam 2026)

    I agree that we almost never wait for a battery to hit 0%. My own
    phone (an el-cheapo, actually free) Galaxy A32-5G from 2021 with a stock
    5AH battery currently shows 2 days and 21 hours of charge remaining.

    As you can see, my GSam averages since Dec 24, 2022, show an average
    of 1 day 19 hours of battery life with 5h 51m of avg screen-on time.

    Why would I charge my phone nightly when it lasts for almost 2 days?
    I charge it when it needs it, where fast chargers take only a few hours.

    As for the physics of cumulative lithium-ion wear being cumulative,
    you are completely correct, where, as you noted with your A16 (135 cycles
    over 18 months), staying in that 20-80% Goldilocks zone is far gentler than full 0-to-100% swings. You didn't mention the charger, but slow charging,
    while it takes longer, also should improve the life of the battery.

    None of that was discussed in my prior purely EU/UK based calculations.

    However, it's important to be clear that the kill-time math I proposed
    actually incorporates your logic automatically as it moves us past the
    "one charge per day" guesswork by using the EU-standardized Daily Cycle
    Ratio (24h / Endurance).

    1. Your A16 stats prove the math, where your ~0.24 cycles/day wear rate
    is exactly what happens when a phone's endurance exceeds the user's
    daily needs. You aren't spending a full cycle every 24 hours because
    your battery capacity & endurance is capacious enough to not need it.

    2. Regarding the kill-time calculation, it accounts for partial cycles
    where, using the EU Endurance Rating (standardized laboratory loads),
    we see how much of a "cycle" is consumed in a standard 24-hour day:
    a. iPhone 17 Pro Max: 53h endurance = 0.4528 cycles/day
    b. Galaxy S26 Ultra: 55h endurance = 0.4363 cycles/day

    3. The reason the Samsung wins, despite Apple's (admittedly brilliant)
    "efficiency" claims, can be termed the bank-account effect.
    Even if one of us owned the iPhone and the other the Samsung,
    and even if we practiced perfect battery hygiene like you do,
    the Samsung user still wins because they are:
    a. Consuming a smaller fraction of a cycle per day (better efficiency)
    b. Drawing from a larger bank account of rated cycles (1,200 vs 1,000)

    Note that the S26 Ultra is using higher-density silicon-carbon chemistry to
    hit that 1,200-cycle mark, while Apple chose to use far cheaper components.

    So what's the bottom line using the EU/UK legally mandated figures?
    Well, I ask others, as always, to check my facts and my math, but given
    total cycles / daily cycle drain = life in days
    a. iPhone 17 Pro Max 1,000 / 0.4528 = ~2,208 days (~6.05 Years)
    b. Galaxy S26 Ultra 1,200 / 0.4363 = ~2,750 days (~7.53 Years)

    If you ask me, a reasonable assessment is that the UK/EU has finally
    exposed that Apple's (admittedly brilliant) "efficiency" marketing does
    not result in a longer-lasting device in this flagship-model comparison.

    Samsung provides ~542 extra days (about 1.48 years) of extra usable health.

    In summary, you're right that practicing good battery hygiene helps, but no amount of careful charging can bridge a 24.5% hardware gap in chemistry.
    --
    On Usenet, wizened old men discuss topics of interest, where each adds
    their own flavor of value so that the group, as a whole, benefits greatly.
    --- Synchronet 3.21f-Linux NewsLink 1.2